
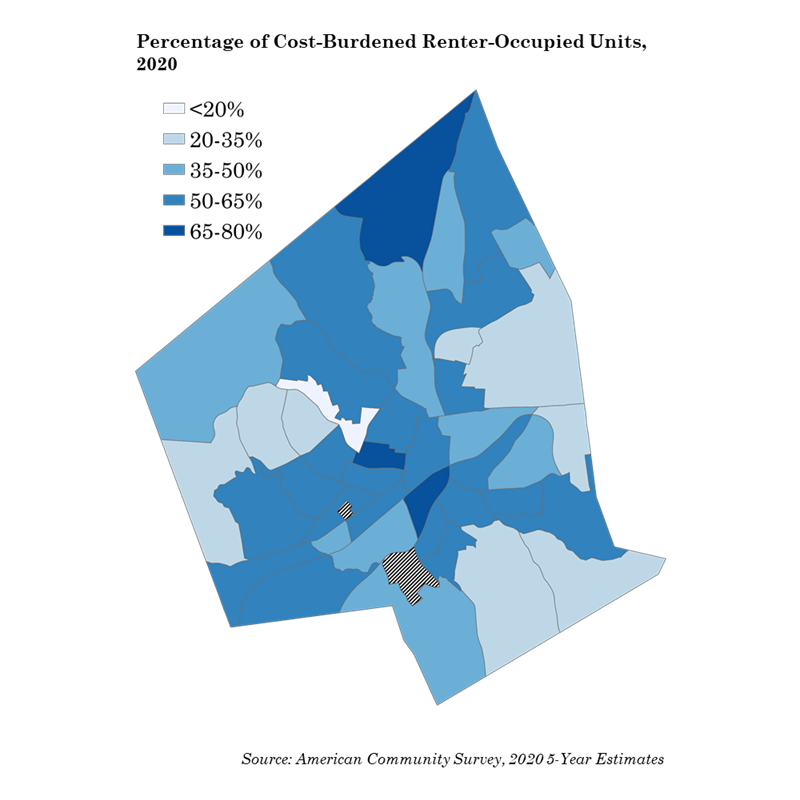
This report examines the state of cost-burdened renter-households in Worcester. Cost-burden, defined as spending more than 30% of one’s gross monthly income on housing, has grown among Worcester renter households. This report focuses on the period between 2010 and 2020, using 5-year estimates from the American Community Survey.
- Demographically, renters in Worcester have much different backgrounds than owners. Renters tend to skew younger, which is typical, and renters are much more likely to be people of color. Renters in Worcester generally have less than a Bachelor’s degree, and tend to move more often. Finally, renters in Worcester are more likely to live in a non-family setting and tend to have only one car. It should be noted that, according to Pew Research Center, these renter characteristics are not unusual nationwide.
- Worcester renter-households (which make up about 58% of all housing units) have become increasingly cost-burdened since 2010. In 2010, 47.7% of renter-households were cost-burdened, growing to 50.5% by 2020. In comparison, owner-households have fared well, decreasing from 39.1% in 2010 to 28.5% in 2020. These numbers are reflected in both the median income and median housing cost: using 2020-dollars, median income for renter-households has increased by 1.45%, while for owner-households it has increased by 1.73%. Costs, however, differ significantly. Again, using 2020-dollars, renter-households have seen their costs grow by 8.85%, while owner-households have seen their own costs decrease by 17.23%.
- Two income ranges among renter-households have become increasingly cost-burdened since 2010: households making between $35,000 and $49,999 and households making between $50,000 and $74,999. Households below these two ranges have remained largely cost-burdened (between 70 and 80%) and households above have remained un-burdened. • Whether compared to cities nearby, like Fitchburg, Framingham, Leominster, and Marlborough, or cities further out throughout the region like Lowell, New Bedford, Quincy, Springfield, Providence, RI and Rochester, NY, Worcester renter-households are not faring well. The growth in median household income is among the lowest compared to each other city (this is true for owner-households as well). While costs haven’t risen as much as in a few other cities, the percentage growth is still among the highest. Overall, with two exceptions, these other cities have seen the percentage of costburdened renter-households decrease, while Worcester has seen this percentage grow.
- The final section of this report presents the Federal Home Owners’ Loan Corporation 1936 redlining map of Worcester. Using a data technique known as geographic apportionment, the report maps income, poverty, race, and percentage of renter-households onto the 1936 redlining zones. The report finds that many of the areas that were originally red- or yellow- zoned remain highly renter-centric, largely non-white, and have generally higher rates of poverty. According to the CDC’s 2020 Social Vulnerability Index, many of these areas remain socially vulnerable across a composite of metrics.
Renter-households in Worcester have become increasingly cost-burdened over time, potentially pricing many long-time residents out of the city. Owner-households have not experienced a similar rise in costs. The City continues to put attention towards this issue, with both public and private investment in new housing, including the creation of Worcester’s Affordable Housing Trust Fund and the discussion over inclusionary zoning.
DOWNLOAD REPORTTo view the full StoryMap, click here.

