
Executive Summary
EACH YEAR on July 1, Massachusetts cities and towns must implement a balanced budget. Worcester’s FY25 budget, Empowering Progress: Investing in Equity, Talent, and Culture, took effect on July 1, 2024. Municipal budgets must cover fixed costs and allocate funds to various public services and initiatives. Budgets reflect a city’s priorities by outlining how resources will be distributed. The Worcester Regional Research Bureau independently reviews the budget to enhance transparency and help residents assess how well the budget meets their needs. This report provides an overview of the City’s budget process, detailing revenues, expenses, and key changes from FY24 to FY25.
PAGE 3-4 | WHO IS IN CHARGE OF THE BUDGET? HOW IS IT APPROVED?
The City Council (11 members) and the City Manager oversee city operations. The Mayor chairs the City Council and School Committee. The Worcester Public Schools are managed by a 9-member School Committee and the Superintendent.
- The City Manager submits the budget to the City Council within 170 days of their first meeting. The Council must vote on it within 45 days or it automatically takes effect.
- The City Council can only reduce spending, while the City Manager has the power to increase or reallocate funds.
PAGE 5 | REVENUE: WHERE DOES THE CITY’S MONEY COME FROM?
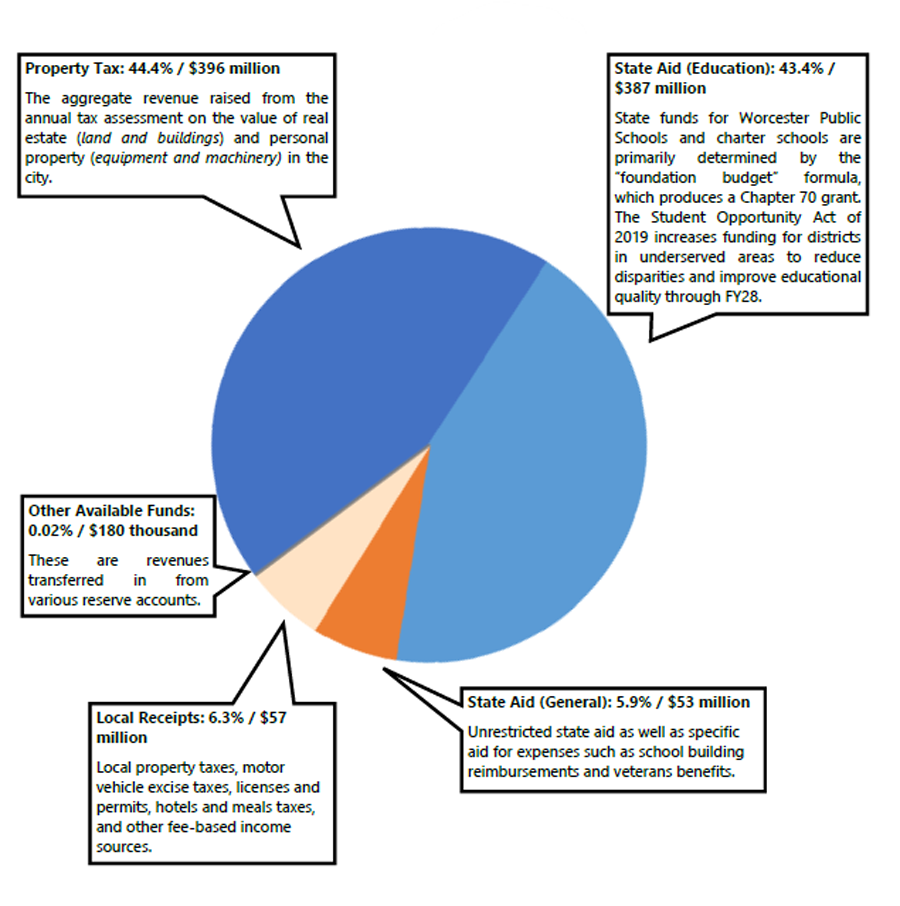
- The City’s budget is approximately $893 million, a 3.0% increase from FY24’s $867 million.
- Revenues come from local property taxes and receipts, state and federal aid, and other smaller revenue streams.
PAGES 6-7 | HOW ARE PROPERTY TAXES ASSESSED?
- The City has a dual tax rate: $13.75 per $1,000 for residential properties and $30.04 per $1,000 for commercial/industrial/personal properties in FY24.
- Worcester has seven active PILOT (Payment in Lieu of Taxes) agreements, expected to generate about $1.7 million in FY 2024.
PAGE 8 | EXPENDITURES: WHERE DOES THE CITY’S MONEY GO?
- $533 million (60%) to education, $195 million (22%) to city services, and $165 million (18%) to fixed costs.
- Spending changes from FY24: Education up 5.3%, city services up 4.4%, and fixed costs down 5.4%.
PAGES 9-10 | HOW DOES THE CITY FUND CAPITAL PROJECTS? IS THERE A PLAN?
- Worcester funds long-term projects like equipment and infrastructure through tax-exempt municipal bonds. Notable expenditures include $41.25 million for school projects, $1 million for traffic signal upgrades, $1.5 million for energy audits and HVAC, and $825,000 for police equipment.
- Worcester funds long-term projects like equipment and infrastructure through tax-exempt municipal bonds. Notable expenditures include $41.25 million for school projects, $1 million for traffic signal upgrades, $1.5 million for energy audits and HVAC, and $825,000 for police equipment.
PAGES 10-11 | POINTS OF INTEREST AND IMPACTS FROM THE STATE
- The school district faced a $22 million shortfall due to inflation, resulting in cutting 355 positions.
- The budget streamlined marketing, HR, and procurement functions within city government.
- The Executive Office of Diversity, Equity, and Inclusion’s budget increased to $850,479, but no new staff were hired in FY24, and the Chief Equity Officer position is still open.
- Local receipts will rise by 7.2%, driven by a 92.3% increase in investment income. However, Medicaid reimbursements for special education services will drop by 45.5%.
- The state’s FY25 budget includes $51 million in unrestricted aid for Worcester (a 3% increase), and raises child care subsidy eligibility to 85% of median income, likely benefiting Worcester families.
PAGE 12 | CONCLUSION
- Summarizes the key revenues, expenditures, and insights from the City’s FY25 budget.
- Understanding the budget is essential for fostering informed discussions on Worcester’s financial priorities.

