
Executive Summary
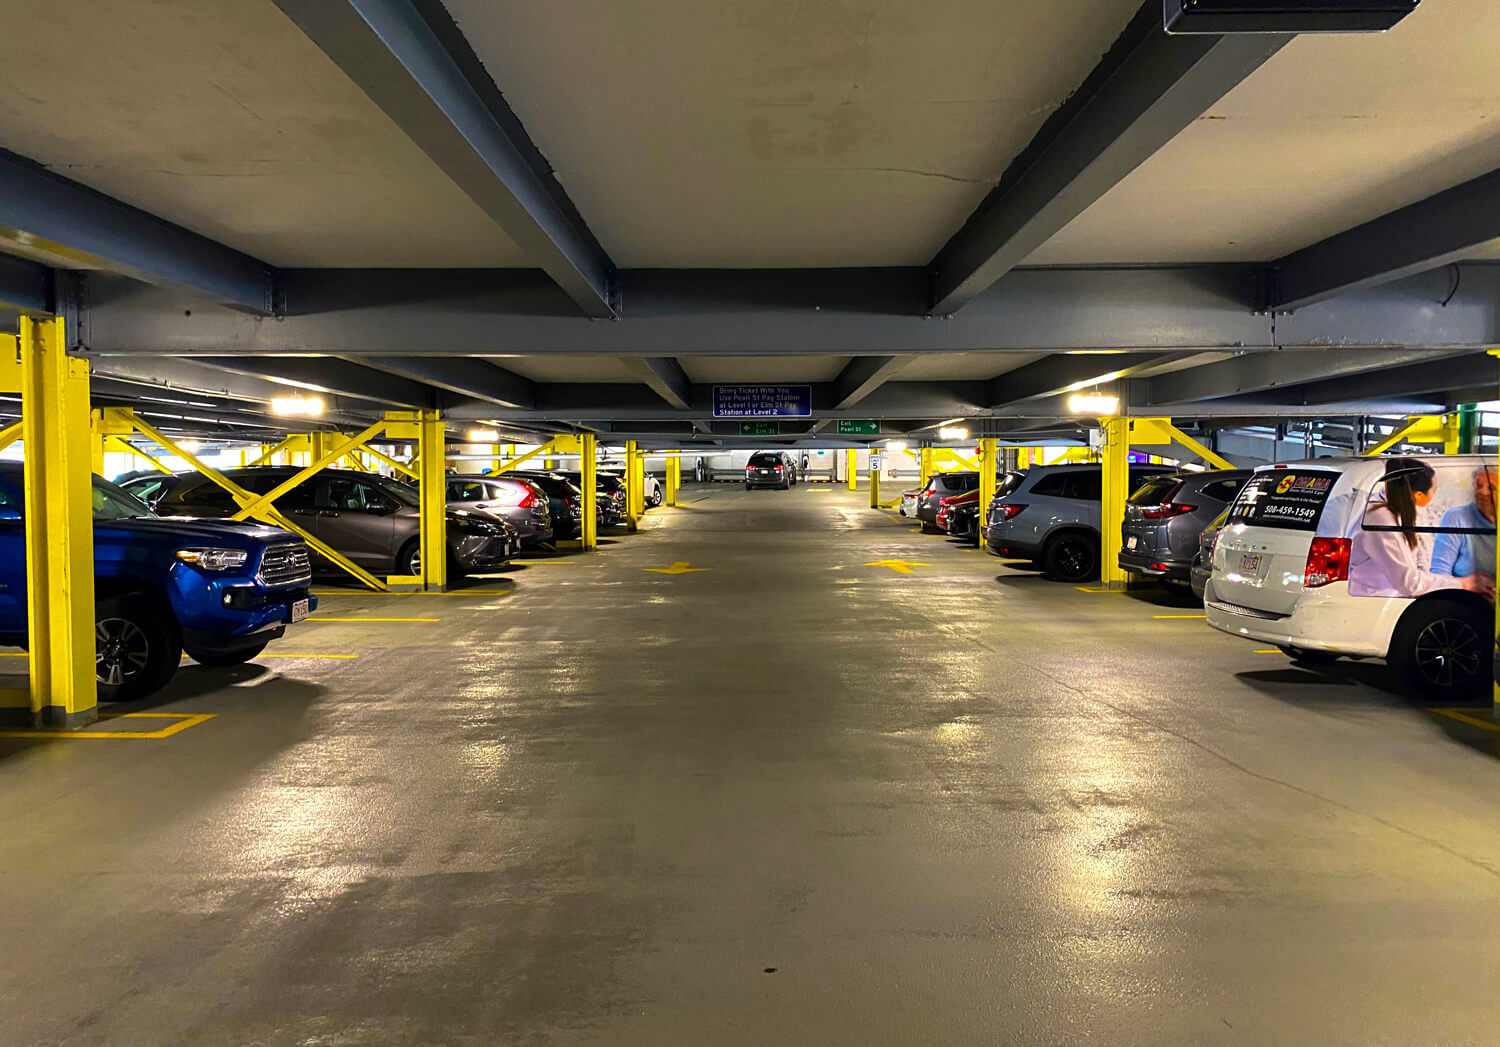
PARKING, is a difficult issue in many cities. Plentiful parking is necessary where the personal automobile is the dominant mode of transportation; and even if other modes predominate, some amount of parking is still necessary. No matter how much parking a city might have, it can still be a charged political issue. In many cities, including in Worcester, the municipal government provides some public off-street parking, creates the rules for on-street parking, and governs the creation of parking in new and existing developments. This report, Part 1 of a two-part Bureau series on parking, dives into the public data from city-owned garages and surface lots, as well as data on on-street parking use. Feeding the Meter finds that parking in city facilities has been strong since a 2021 downturn, but that some garages are under-performing. In addition, since the City adopted a Department of Transportation and Mobility and switched on-street parking to kiosks and a mobile app, it has seen more people using the mobile app year over year.
PAGES 3-6 | DISCUSSES THE GENERAL STATE OF PARKING IN WORCESTER
- Worcester has five municipally owned garages and five public surface lots open-year round. Two more lots, the MBTA/Amtrak and Grafton St Lots are managed by the City. All are located in Downtown or the Canal District.
- These garages and lots represent over 4,000 parking spaces, on top of the many parking spaces available in privately owned garages and lots.
- Maps on page 5 show the extent of public and private parking in Downtown, the Canal District, and down Park Ave.
- The City has paid, on-street parking located primarily Downtown, with pockets elsewhere. A map of these is located on page 6.
PAGES 6-11 | ANALYZES MOBILE APP AND KIOSK DATA FOR ON-STREET PARKING
- In 2021, the City replaced single space meters with pay-by-plate, using centralized kiosks and mobile app zones to keep track of parking.
- Since the adoption of the mobile app, each month of app use has seen higher revenue than the same month the year before, and each year has collected more revenue than the year before in the app.
- Average time for on-street parking transactions has remained stable since 2021, but each year has seen greater time spent in the non-gated surface lots.
- Kiosks have seen slightly greater revenue collection than the mobile app, but have not seen year-over year growth.
- Both app and kiosk usage see revenue drop offs in July, and in the Fall months; during baseball season, two lots, Lamartine and Madison St, are included in the app and kiosk usage numbers as they are Polar Event Lots only. They are not otherwise used for parking.
PAGES 12-16 | EXAMINES MONTHLY OCCUPANCY OF THE MUNICIPAL GARAGES AND THE MCGRATH LOT
- The McGrath (Library) Lot is included in this data as it has gated access and a similar payment system to the garages.
- Just like the use of on-street and surface lots sees a reduction in July, the garages and gated lots in general see a reduction in use over the same time frame.
- By far the most used garage is Major Taylor; whether that is monthly pass holders or transient users (temporary parkers), Major Taylor is consistently the top garage for occupancy. Federal Plaza is a close second.
- In terms of volume of users, McGrath had more monthly pass users entering it each month than either Union Station or Worcester Common, every month between December 2022 and April 2024.
- Pearl Elm is the only garage with fewer average transient users each month than its average number of monthly pass holders users.
- Major Taylor has the most transient users between 5 AM and Midnight on Weekends in the period under study; and for most months had the most monthly pass users during the same time frame on weekdays.

